
Hosting Data from Your PostgreSQL Database on GeoServer
This article is part three of a series on creating your own open-source GIS architecture. The first article covered setting up a PostgreSQL database with the PostGIS extension on AWS and creating an EC2 instance of Ubuntu running GeoServer. The second article discussed managing the database with QGIS. Several readers contacted me asking, what is the GeoServer for? This is a valid question, since to this point, we have only logged in to GeoServer to make sure it was operational. This article will cover the role of Geoserver and how to use it.
About the Architecture
I want to take a moment to discuss the components of the open-source GIS and how they work together. When I decided to start this project, my goal was to create something similar to the configuration of ESRI ArcGIS Server and ArcSDE. While similar to ESRI’s typical architecture, the one I designed is different. Below is a schematic of the components of the system. I think this helps to visualize how it works together.

At the top of the diagram are the RDS and EC2 instances created on AWS. Similar to ESRI’s architecture, our database and GIS server are on two different machines. Having the database and GIS server on two separate virtual machines has benefits over having everything stored on a single computer. In the IT world, this is known as Separation of Duties (SOD). In this system, the two machines are dedicated to their specific roles. If one needs to scale up, it can be done without affecting the other. You can also leverage the data in the database in other ways without impacting the performance of your GIS webserver. Ultimately, using two machines can have performance and cost advantages.
Having the database on a separate machine also helps to mitigate security risks. It is better to have the data stored on a machine that is not open to the web. You can also limit who has access to particular computers, which can further mitigate security risks.
At the bottom of the diagram is the local machine used to manage the database with QGIS and configure GeoServer. The right side of the diagram is the point of data consumption through the web or on a desktop GIS application.
Back to the Question, What is the GeoServer For?
Simply put, GeoServer takes GIS inputs and processes them into outputs, or services, that are more easily consumed over the web than the raw inputs would be. Inputs can come in many forms, such as shapefiles, geopackages, rasters, ArcGrids, image mosaics, and other services. In this tutorial, the input dataset will be data from the PostgreSQL/PostGIS server. Using the database has the advantage of being able to write to the data as opposed to just reading it.
There are four types of services available in GeoServer based on the Open Geospatial Consortium’s standards. Here is more information on the four types of services:
Web Mapping Services (WMS) provide the map as an image such as a PNG or a JPEG. WMS can be used for both vector and raster data and support queries such as map tips;
Web Feature Services (WFS) provide features with their geometry and attributes. GeoJSON is the most common formate of a WFS. However, it can support formats such as shapefiles and CSVs. WFS only support vector data;
Web Coverage Services (WCS) are similar to WFS but serve raster data. WCS provide tile services that take large raster data and divide them into sections, or tiles, that only load in the geographic area where the map is being viewed. Tile services allow the data to be consumed more efficiently online. Both WFS and WCS ensure that your data will not surpass the 1 GB file limitation set by Leaflet and OpenLayers;
Web Processing Services (WPS) provide geoprocessing such as calculations and algorithms. They are essentially geoprocessing tools available online that can write to data locally or on a database. Unfortunately, WPS are not supported out-of-the-box in GeoServer and must be added with an extension.
Here is another diagram to help illustrate how GeoServer works.

I did not include all of the potential inputs.
Organization of data on GeoServer
GeoServer stores data in a hierarchical structure. The components are:
Workspaces are the highest level. They are similar to directories or folders where associated data can be stored. Workspaces can also be used to restrict access to data to specific individuals;
Stores are where the data are stored physically on a disk. Workspaces can have multiple stores and are associated with the GIS data such as shapefile, geopackages, PostGIS tables, and rasters;
Layers are the maps within the stores that are served to applications such as Leaflet, OpenLayers, Mapbox, or other desktop software;
Layer Groups are another way GeoServer organizes but are not truly part of the hierarchy. These are groups of layers that can be served together when needed.
Getting Your Hands Dirty with GeoServer
First things first, you need to log in to GeoServer. We did this back in the first article, but in case you forgot, the URL will be the IP from AWS of your EC2 instance followed by “:8080/geoserver/web/”. The default username is “admin” with the password “geoserver”. If you haven’t changed the default, you need to do that before proceeding.
Once you are logged in, you will see the GeoServer homepage. The left-hand column contains a list of tools you will use to manage the server. The tools are grouped into related categories, such as the About & Status tool group that will give you information about the server. A valuable tool in this section is the GeoServer Log, which can be used to troubleshoot any problems you have.

You will primarily work with the Data group in this tutorial. Notice the tools in this group are in the order of the hierarchy of data organization I described above. (Workspaces, Stores, Layers, Layer Groups) This is very useful because you will work your way down this list of tools when you add data to the server.
The first tool in the Data group is the Layer Preview. The tool is not part of the hierarchy, but it will give you a list of all the layers available on your GeoServer. Several workspaces and layers come preinstalled with which you may want to experiment. Clicking on Layer Preview will bring up a list of those layers. If you click on the OpenLayers link in the Common Formats column, you will see a new browser tab previewing the data.
Adding Data to GeoServer
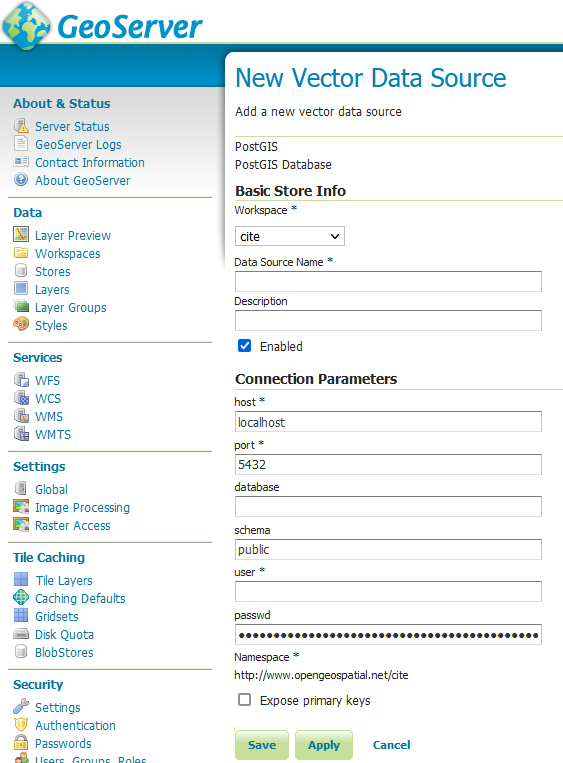
First, you will need to create a new Workspace to hold your data. Click the Workspaces tool from the Data group on the homepage. You will see the Workspaces dialogue. Click the green plus button at the top of the page to add a new Workspace. Give the Workspace a name. The name should not contain blank spaces. The Workspace will also require Namespace URI. The name can be anything unique. In this example, I used my website’s URL followed by postgis. Click Save, and you should see a list of Workspaces with the new one added.

Next, you will need to create a new data Store. Click Stores or you can first navigate back to the homepage by clicking the GeoServer icon in the top lefthand corner. Once you have navigated to the list of Stores, click the green plus button to add a new Store. Here you will see a list of all the different inputs that can be loaded on the server. In this tutorial, you will use your PostGIS database, but you could use any of the other inputs, such as a shapefile stored on your computer.
Click PostGIS. This will bring up the dialog for adding a new Store. Select your new Workspace from the dropdown. You will need to give the Store a name. The host will be the Endpoint for your RDS, which can be found back on your AWS RDS Dashboard if you have forgotten. The default port is 5432 unless you changed it at some point. You will need to specify to which database and schema from the RDS you want to connect. You can get the names of your database and schema on pgAdmin. Finally, you will need to give the security credentials for the database. Leave everything else as the default and click Save.
Next, you will add a Layer. Click Layers from the list of tools on the homepage. Click the green plus to add a new Layer. You will choose from which Store you want to add a Layer. Choose the PostGIS Store you just created. A list of Layers that are available in the Store will appear. Select publish next to the Layer. The Edit Layer dialog will appear. You can change the name if you want. You will need to ensure the Coordinate Reference System is correct. GeoServer will try and determine this automatically. You can double-check the coordinate system by loading the data into QGIS. Right-click the feature on the layers pane and navigate to Source. You will next compute the bounding boxes by clicking Compute from data and Compute from native bounds. Click Save. You will see your new feature in the Layers list.

Back on the list of tools, choose the Layer Preview option. You should see the Layer you just created. Click the OpenLayers link in the Common Formats column. A new tab will appear with an OpenLayers map of your data. The data will be symbolized in the default symbology.
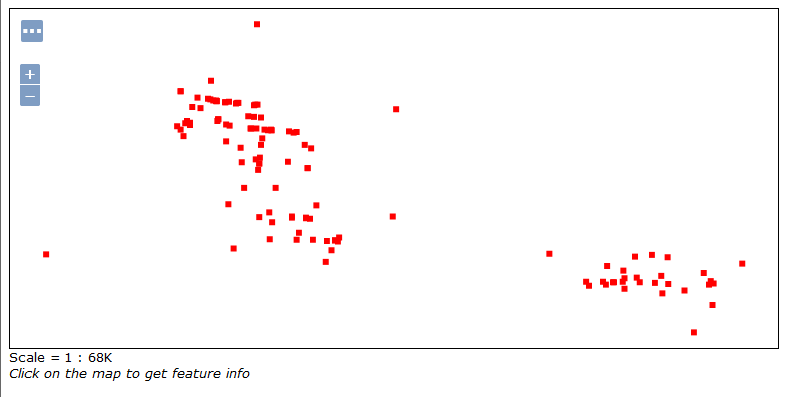
My unsymbolized data in the OpenLayers format.
Symbolizing Your Data
Next, you will want to symbolize your data into something more appealing than the default style. GeoServer stores symbology and labeling in XML documents called Styles. You can apply the Styles to multiple Layers on the server. You can create your customized Style in QGIS by symbolizing and labeling your data and storing the symbology as a Style Layer Definition file (SDL).
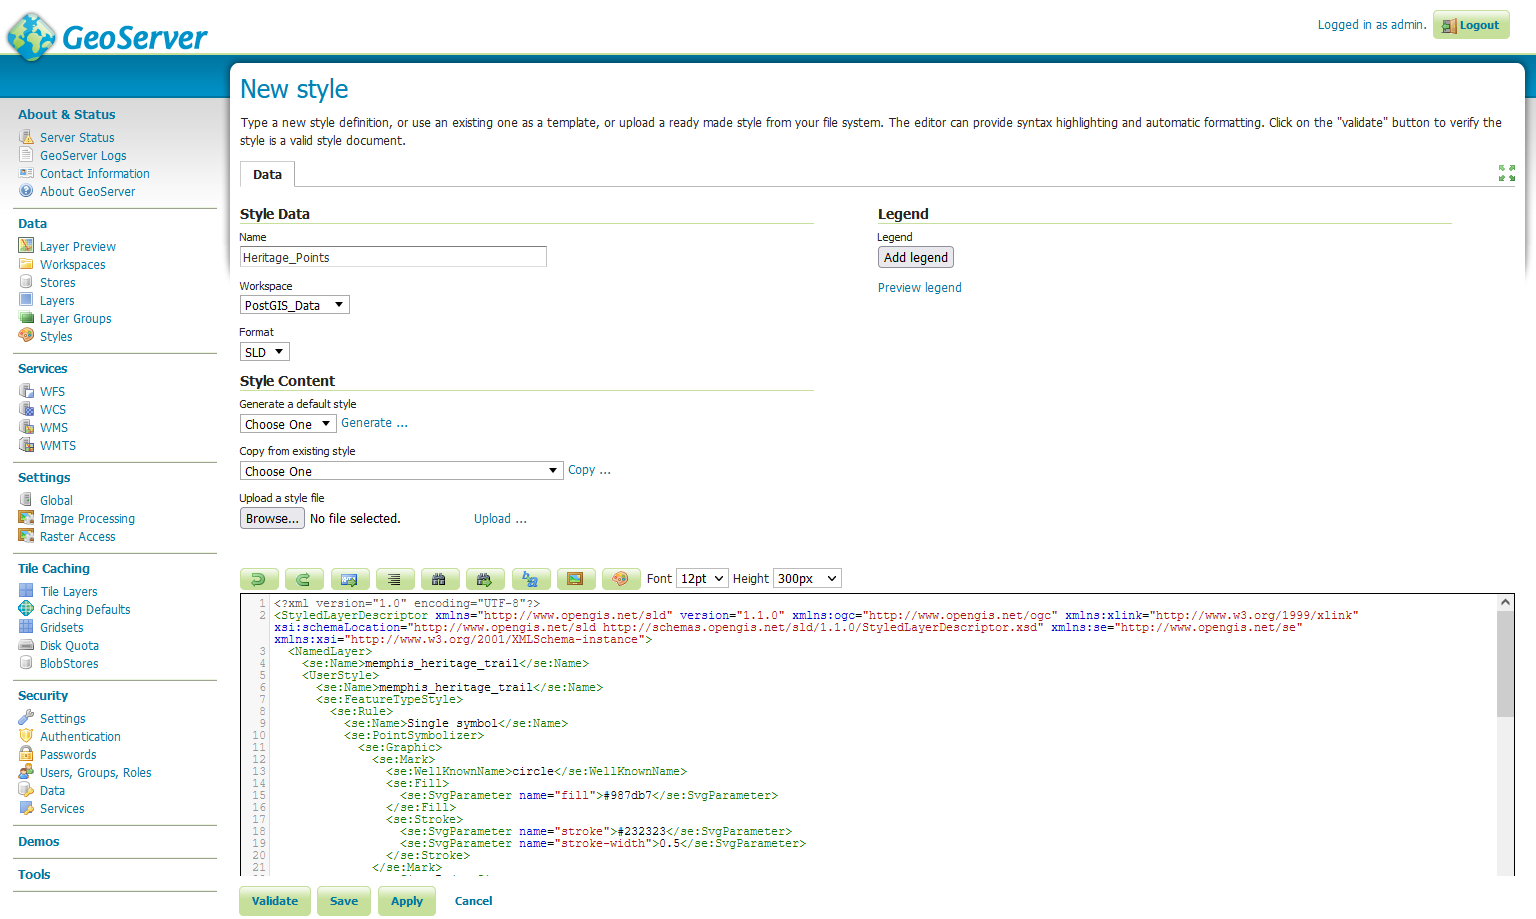
To do this, load your data into QGIS. Right-click the feature in the Layers pane and select Layer Properties. From the Symbology and Labels tabs, you can configure your symbology and labeling to your liking. Click the Style button in the left-hand bottom of the options. Select Save Style, and you will see the Save Layer Style dialog. Use the first dropdown to save the Style as an SDL file somewhere on your local machine.

Go back to GeoServer and select the Styles tool from the Data tool group. Select the green plus to add a new Style. The New style dialog will appear. Give your Style a name and choose the Workspace where you want it to be stored. Click the Browse button and navigate to where you stored your SDL file on your local machine. Select the file and click Upload. The XML for your Style will be loaded into the window. Click Validate to ensure that there are no validation errors. Click Save.
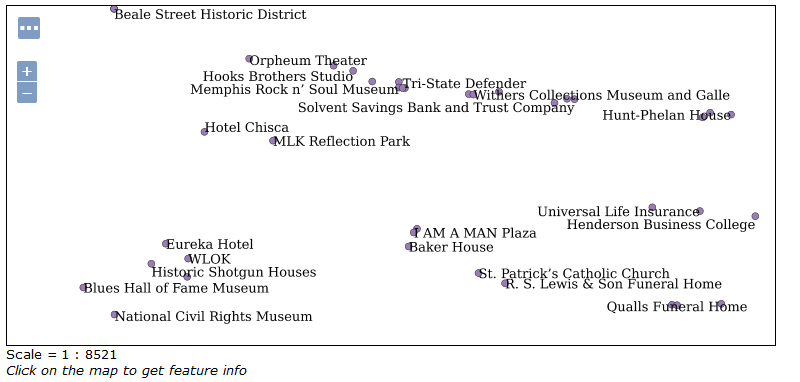
Go to your Layers tool. Select the Layer to which you want to apply the Style. Select the Publishing tab at the top of the page. Towards the bottom of the page, you will see the Layer Settings and Default Style. Select the Style you just created from the list and click Save.

Navigate to the Layers Preview using the list of tools and select the OpenLayers link in the Common Formats column. The Style you created will be applied to your Layer.
Final Thoughts
In this article, I covered the basics of using GeoServer to host data from a PostgreSQL database. The basics ended up being a lot more material than I thought. I initially planned on also writing about using a Layer on a Leaflet map. Instead, I will write about using the Layer with Leaflet and how to connect to the Layer with desktop GIS applications in my next article.
I have received a lot of feedback from the readers of the first two articles. Some of you gave suggestions for additional topics to cover. Let me know if there is something that I have covered that you would like me to write about in more depth or if there is a related topic you want me to cover. You can reach me through my Reddit posts, the comment section below, or the contact page on my website.