
Shelby County Census Viewer
Simplifying Access to American Community Survey Data with ArcGIS Experience Builder
Background
The Office of Performance Management wanted to provide City staff and partner organizations with an easier way to explore demographic information for Shelby County. The project was inspired by a similar Census Viewer developed by the City of Cleveland, with guidance from an Esri consultant on implementing the concept within the City's ArcGIS environment.
While the U.S. Census Bureau provides comprehensive access to American Community Survey (ACS) data, navigating the available datasets and identifying the appropriate variables can be challenging for users who are unfamiliar with Census products. The objective of this project was to create a map-based application that presents commonly requested demographic and socioeconomic indicators in an intuitive format, allowing users to quickly explore neighborhood characteristics without requiring specialized Census knowledge.
Challenges
Developing the application required more than simply displaying Census data on a map. The first challenge was determining which demographic indicators would provide the greatest value to users. With thousands of ACS variables available, the project required carefully selecting a curated set of measures that would answer the most common demographic questions while keeping the application straightforward to navigate.
Once the variables were identified, the data acquisition process had to be designed. This involved researching the Census API documentation, identifying the appropriate variable codes, and constructing API requests capable of retrieving all selected indicators for every Census tract in Shelby County.
A second challenge emerged during the first annual data update. Although the workflow had been designed to update the ACS vintage by modifying the year within the API request, several variable codes changed between the 2023 and 2024 releases. Recognizing that the resulting values appeared inconsistent, I investigated the issue, identified the revised variable definitions, and updated the API requests to ensure the application continued to display accurate information.
Finally, the application architecture required managing twenty-six individual thematic maps within ArcGIS Experience Builder. Each variable required its own map layer, cartographic symbology, pop-up configuration, data connection, and application page while maintaining a consistent user experience throughout the site.
My Role
I independently designed and implemented the data acquisition workflow, developed the ArcGIS Online content, configured the Experience Builder application, and documented the annual update process to support long-term maintenance.
My responsibilities included:
Identifying and selecting 26 ACS variables across five thematic domains.
Researching Census API documentation and constructing custom API endpoints.
Building Power Query connections in Excel to retrieve ACS data directly from the Census API.
Joining Census data to tract boundaries in ArcGIS Pro and publishing updated hosted feature layers.
Designing thematic maps with customized symbology, transparency, labels, and pop-ups.
Developing a multi-page ArcGIS Experience Builder application.
Writing step-by-step documentation for annual data updates and application maintenance.
Technical Approach
The application combines several technologies into a repeatable annual workflow.
ACS data are retrieved directly from the U.S. Census Bureau using custom API endpoints developed from Census documentation. Power Query is used to import the selected variables into Excel, allowing future updates to begin by modifying the API request rather than rebuilding the extraction process.
After validating the updated data, the demographic attributes are joined to Census tract boundaries within ArcGIS Pro and published to ArcGIS Online as hosted feature layers. Individual thematic layers are then created for each variable, allowing customized cartographic symbology and informative pop-up configurations.
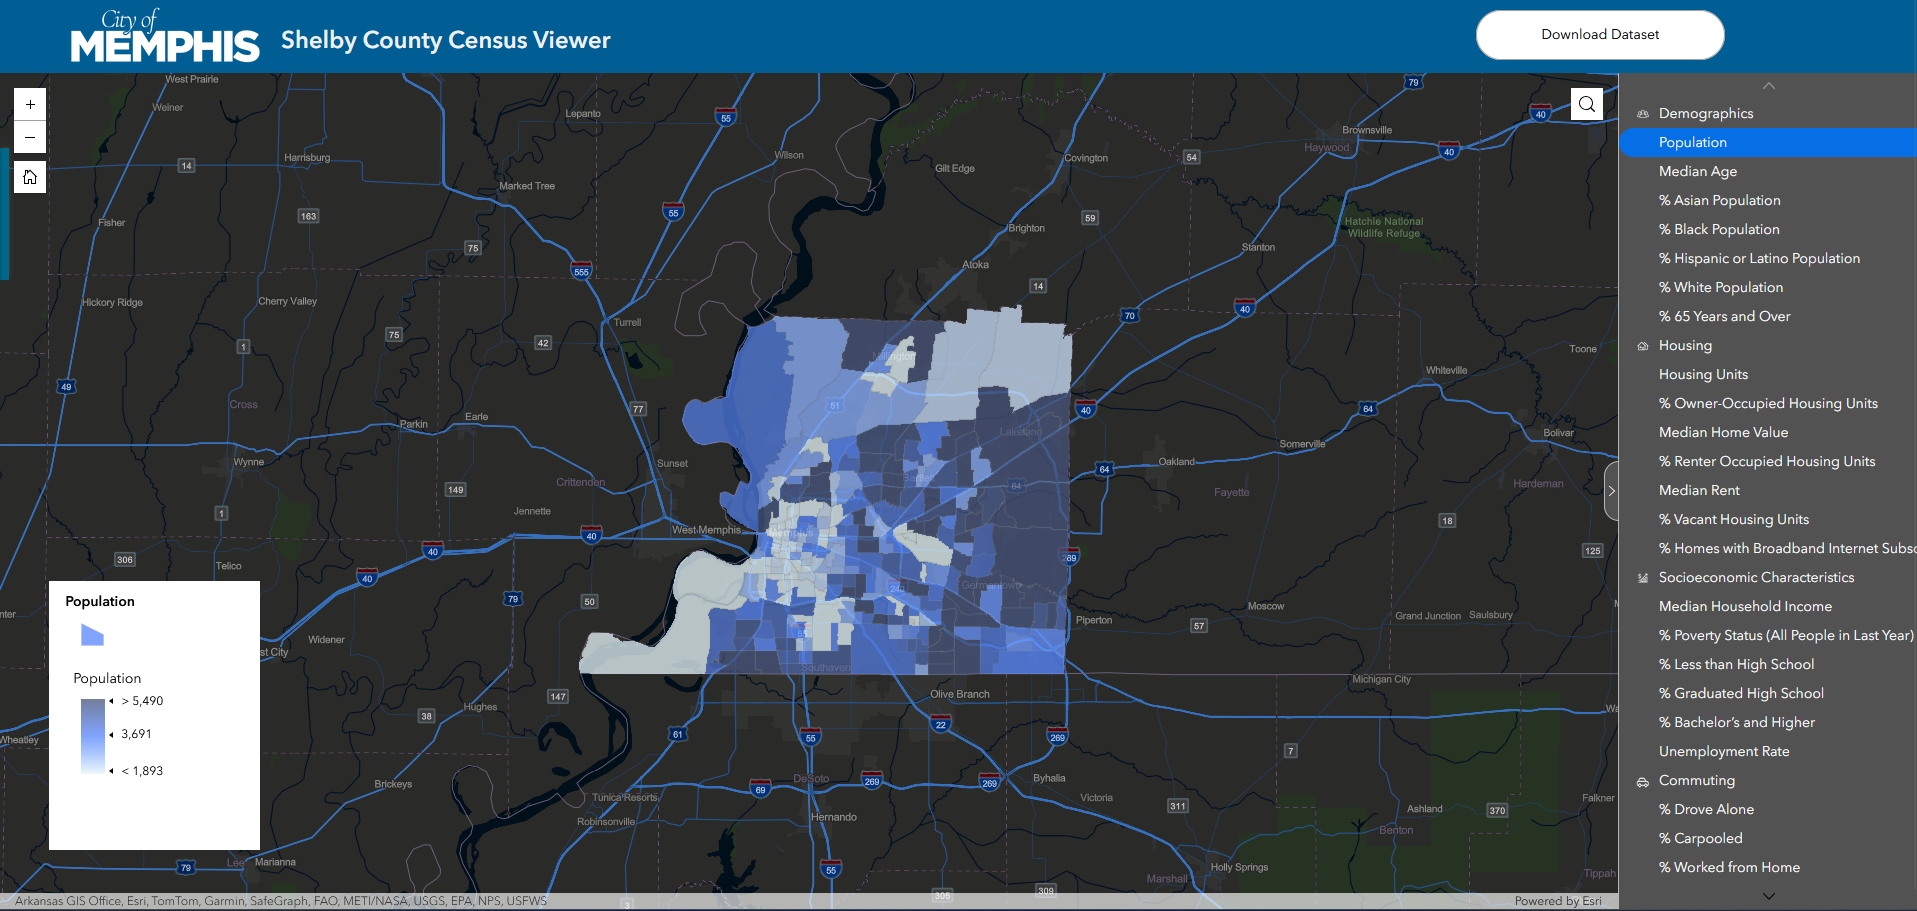
The ArcGIS Experience Builder application organizes the data into five thematic categories:
Demographics
Housing
Socioeconomic Characteristics
Commuting
Health
Across these categories, users can explore 26 demographic variables using dedicated application pages with consistent navigation and map design.
Additional functionality includes address search, interactive pop-ups, tract labels at neighborhood scale, and the ability to download the complete dataset directly from the application.
Results
The completed application provides City staff, partner organizations, students, and other users with a simple interface for exploring demographic conditions throughout Shelby County.
Rather than requiring users to locate and interpret ACS tables directly from the Census Bureau, the application presents curated demographic indicators through interactive maps that can be searched by address and explored visually.
The project also established a standardized annual update workflow. Although Census variable definitions occasionally change between ACS releases and require manual verification, the documented process enables the application to be refreshed each year without redesigning the project or rebuilding the data pipeline from scratch.
Since its release, the application has been adopted by internal users and external audiences, including students who have used the site to download demographic datasets for analysis.
Lessons Learned
This project reinforced that creating useful public-facing data products involves far more than publishing authoritative data. Equally important is reducing the effort required for users to find, understand, and apply that information.
It also demonstrated the importance of designing for long-term maintenance. By documenting each stage of the annual update process and building a repeatable workflow for acquiring, validating, publishing, and configuring ACS data, the application can continue to evolve as new Census releases become available.
Perhaps most importantly, the project highlighted the value of data curation. Selecting a focused set of demographic indicators and presenting them through an intuitive interface proved more valuable to many users than expecting them to navigate thousands of variables available through the Census Bureau's website.
Technologies Used
ArcGIS Pro
ArcGIS Online (Hosted Feature Layers)
ArcGIS Experience Builder
American Community Survey (ACS)
U.S. Census Bureau API
Microsoft Excel Power Query
REST APIs
Data Visualization
ETL (Extract, Transform, Load)
Technical Documentation